Dashboard
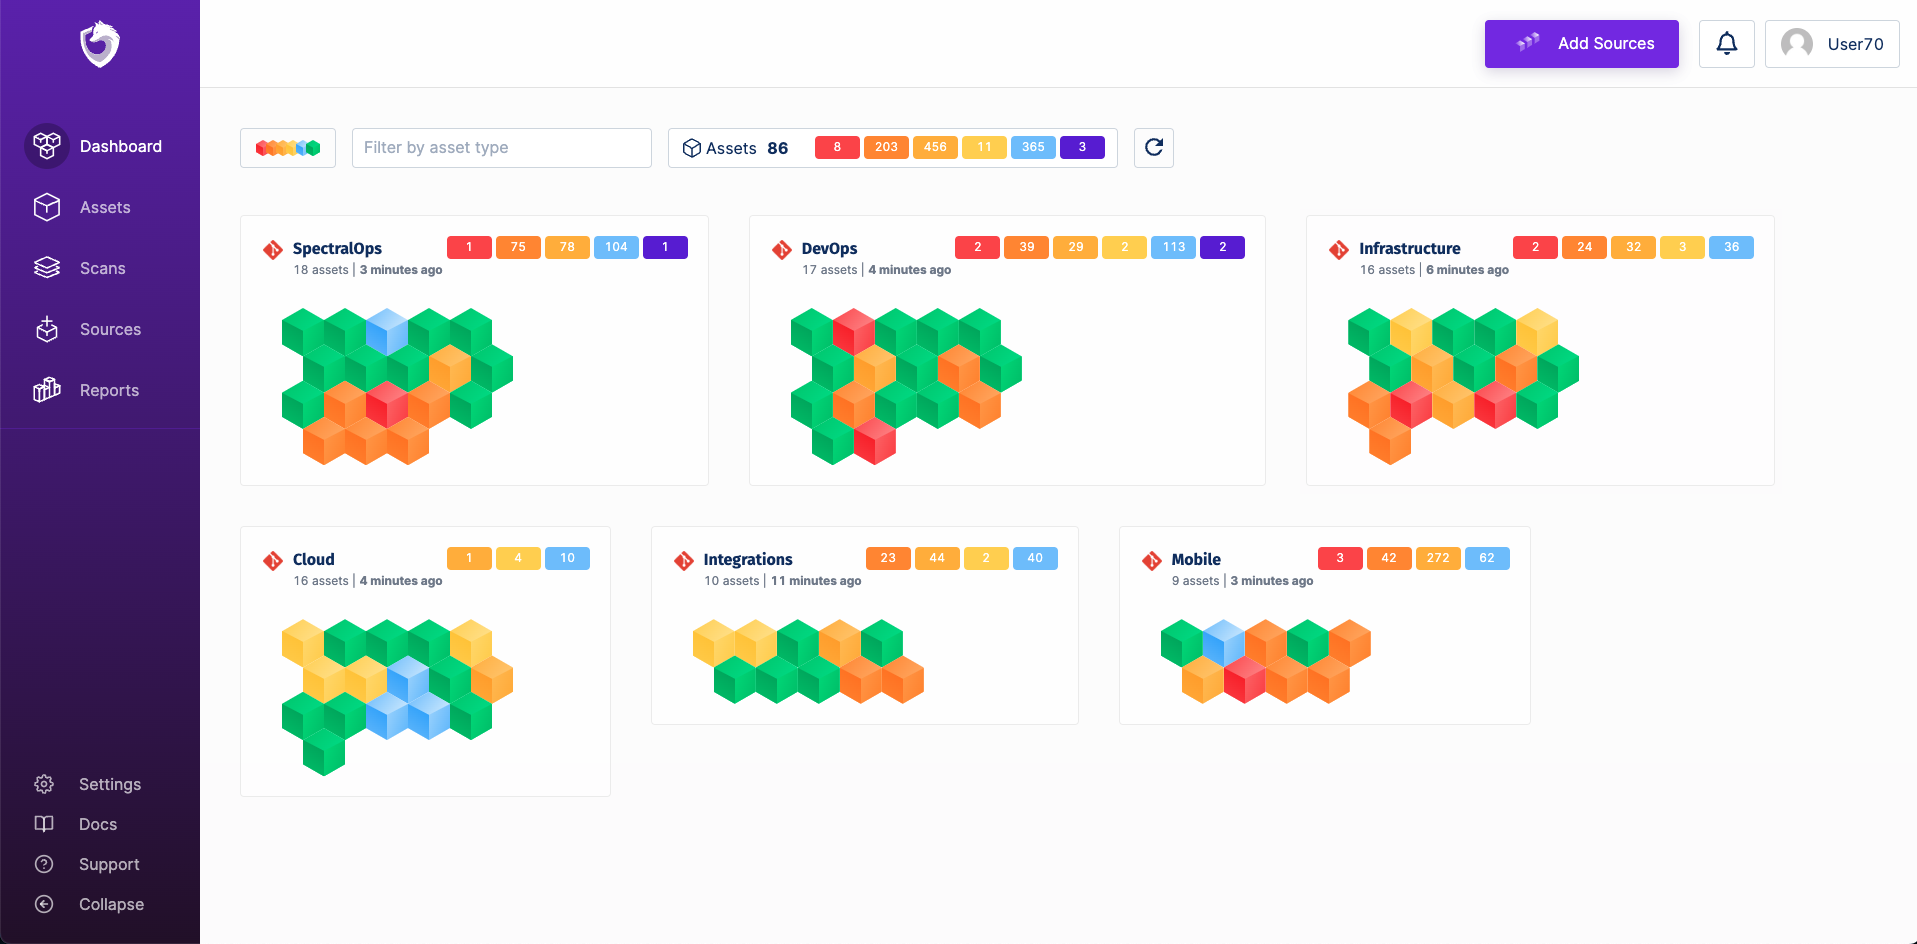
The Dashboard page provides a bird’s eye view of all your organization assets, Each card can represent a team/department or any other logical unit (to review how to create the logical mapping, visit asset mapping).
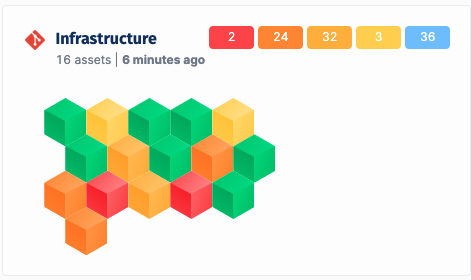
For each of the logical units, you can review the total number of issues based on their severity.

Each cube inside the cards represents an asset, like a repository or a container.
Spectral provides four different statuses for your assets:
- Red - An issue with a critical severity was detected
- Dark Orange - An issue with a high severity was detected
- Orange - An issue with a medium severity was detected
- Yellow - An issue with a low severity was detected
- Blue - An issue with an informational severity was detected
- Gray - Spectral scanner didn’t scan the asset in the past seven days. This can be due to few reasons like someone didn’t run any build in the past week or someone deleted spectral scanner from the CI, So you need to check it with the team admin or review your CI configuration.

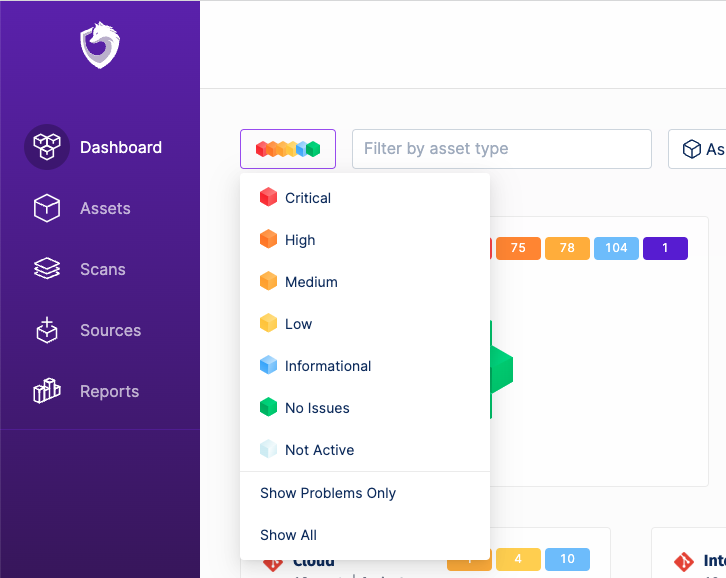
The status filter in the upper-left corner can help you focus on assets of a specific status.

You can filter out any of the findings by clicking it.
Once you click on one of the assets, you will be redirected to the asset page.
Updated 8 months ago